YouTube Insights Explorer

YouTube Insights Explorer

YouTube Insights Explorer

Decoding Channel Success Across Categories

Decoding Channel Success Across Categories

Decoding Channel Success Across Categories

Introduction

Welcome to my comprehensive YouTube Data Analysis project. This initiative aims to provide deep insights into the landscape of YouTube channels across various categories. By leveraging data from the YouTube API, I conducted an extensive analysis of channel performance, content strategies, and audience engagement across news, gaming, education, technology, and entertainment sectors.


Project Objectives

1. To collect and analyze data from a diverse range of YouTube channels

2. To identify trends and patterns in channel growth and performance

3. To compare metrics across different content categories

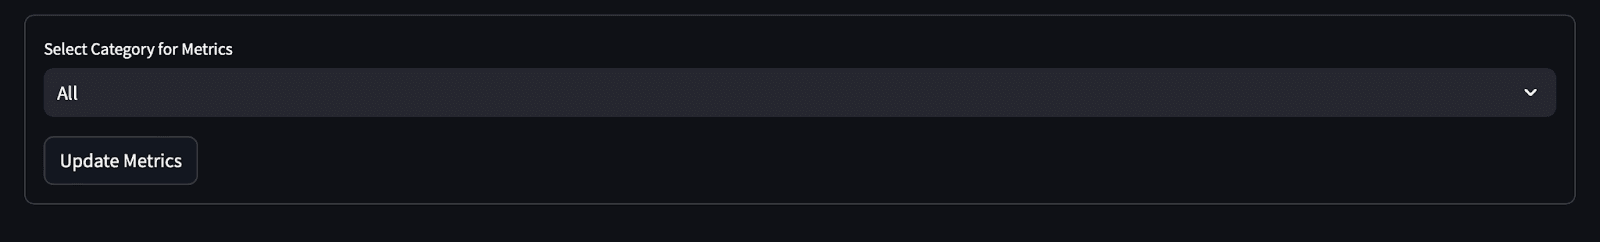
4. To create an interactive dashboard for easy exploration of insights

5. To provide valuable information for content creators, marketers, and researchers


Methodology


Data Collection:

I utilized the YouTube Data API to gather information from 150 channels in each of our five target categories: news, gaming, education, technology, and entertainment. This process involved:

- Implementing a search function to identify relevant channels

- Extracting key metrics such as subscriber count, view count, and total videos

- Handling API rate limits and potential errors

- Storing data efficiently for further analysis


Data Preprocessing:

Raw data underwent several cleaning and preprocessing steps:

- Converting data types (e.g., subscriber counts to integers)

- Handling missing values

- Extracting and formatting date information

- Creating derived metrics like average views per video


Analysis and Visualization:

We employed various analytical techniques and visualization tools:

- Statistical analysis using Python and Pandas

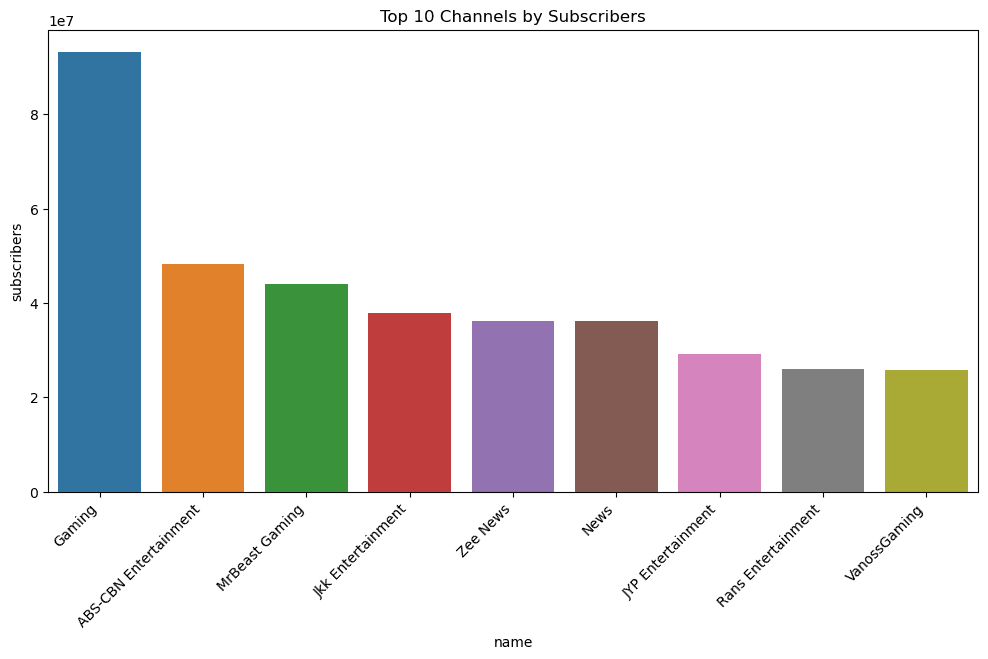
- Data visualization with Matplotlib and Seaborn

- Creation of histograms, scatter plots, and bar charts to illustrate key findings


Interactive Dashboard


To make our findings more accessible and engaging, I developed an interactive dashboard using Streamlit. This dashboard offers:


1. Dynamic Metrics Display:

- Users can select specific categories to view average metrics like total videos, subscribers, and views

- Gauge charts provide an intuitive visualization of these metrics

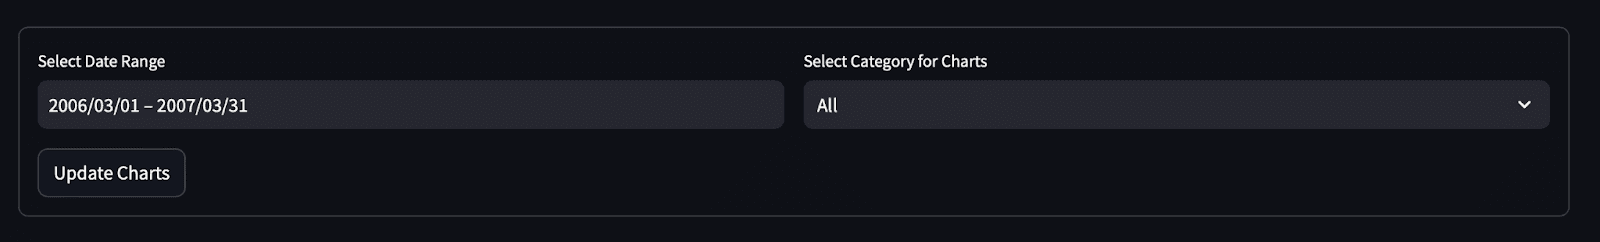
2. Time-based Analysis:

- Interactive date range selection allows users to focus on specific time periods

- Visualizations update in real-time based on selected date ranges

3. Trend Visualization:

- Bar charts and line graphs illustrate trends in subscribers, views, and video uploads over time

- Users can compare trends across different categories

4. Customizable Views:

- Options to filter data by category, allowing for focused analysis

- Multiple chart types to cater to different analytical needs

3. Trend Visualization:

- Bar charts and line graphs illustrate trends in subscribers, views, and video uploads over time

- Users can compare trends across different categories


4. Customizable Views:

- Options to filter data by category, allowing for focused analysis

- Multiple chart types to cater to different analytical needs

Technical Implementation


1. Data Collection and Processing:

   - Utilized Python's googleapiclient library to interact with YouTube Data API

   - Implemented error handling and retry logic for robust data collection

   - Used Pandas for efficient data manipulation and analysis


2. Visualization:

- Leveraged Plotly for creating interactive and responsive charts

- Implemented custom color schemes and layouts for improved readability


3. Dashboard Development:

- Built with Streamlit, allowing for rapid prototyping and deployment

- Incorporated user input forms for dynamic data filtering

- Optimized for performance with large datasets


Challenges and Solutions


Throughout the project, we encountered several challenges:

1. API Rate Limiting: Implemented intelligent pausing and batching of requests

2. Data Inconsistencies: Developed robust cleaning algorithms to handle various edge cases

3. Performance Optimization: Utilized efficient data structures and caching mechanisms for the dashboard


Graphs and Visualisations