Discover the patterns behind fashion purchases and consumer behavior through our comprehensive analysis of clothing store sales data.
Introduction
In an era where data drives decisions, understanding consumer behavior in the fashion industry is crucial. Our project delves into the sales data of a prominent clothing store, unveiling insights that can reshape marketing strategies and inventory management.
Project Overview
Using advanced Excel techniques, we analyzed a rich dataset containing information on customer demographics, purchase patterns, geographical distribution, and more. Our goal? To transform raw data into actionable insights for the fashion retail sector.
The Process
Data Journey: From Raw to Refined
1. Data Collection: Gathered extensive sales data including gender, age, purchase date, order status, sales channel, product size, quantity, amount, shipping details, and B2B information.
2. Data Cleaning: Duplicated the original dataset to create a working sheet, ensuring data integrity throughout the analysis.
3. Pivot Table Magic: Utilized Excel's powerful pivot table feature to slice and dice the data, revealing hidden patterns.
4. Dashboard Creation: Developed an interactive dashboard featuring dynamic charts and filters for real-time data exploration.
Key Analyses
Unveiling Fashion's Hidden Patterns
• Temporal Trends: Tracked monthly sales and order volumes to identify seasonal patterns.
• Customer Demographics: Analyzed spending habits across genders and age groups.
• Order Fulfillment: Examined the distribution of order statuses to gauge customer satisfaction.
• Geographical Insights: Mapped sales data to identify top-performing states.
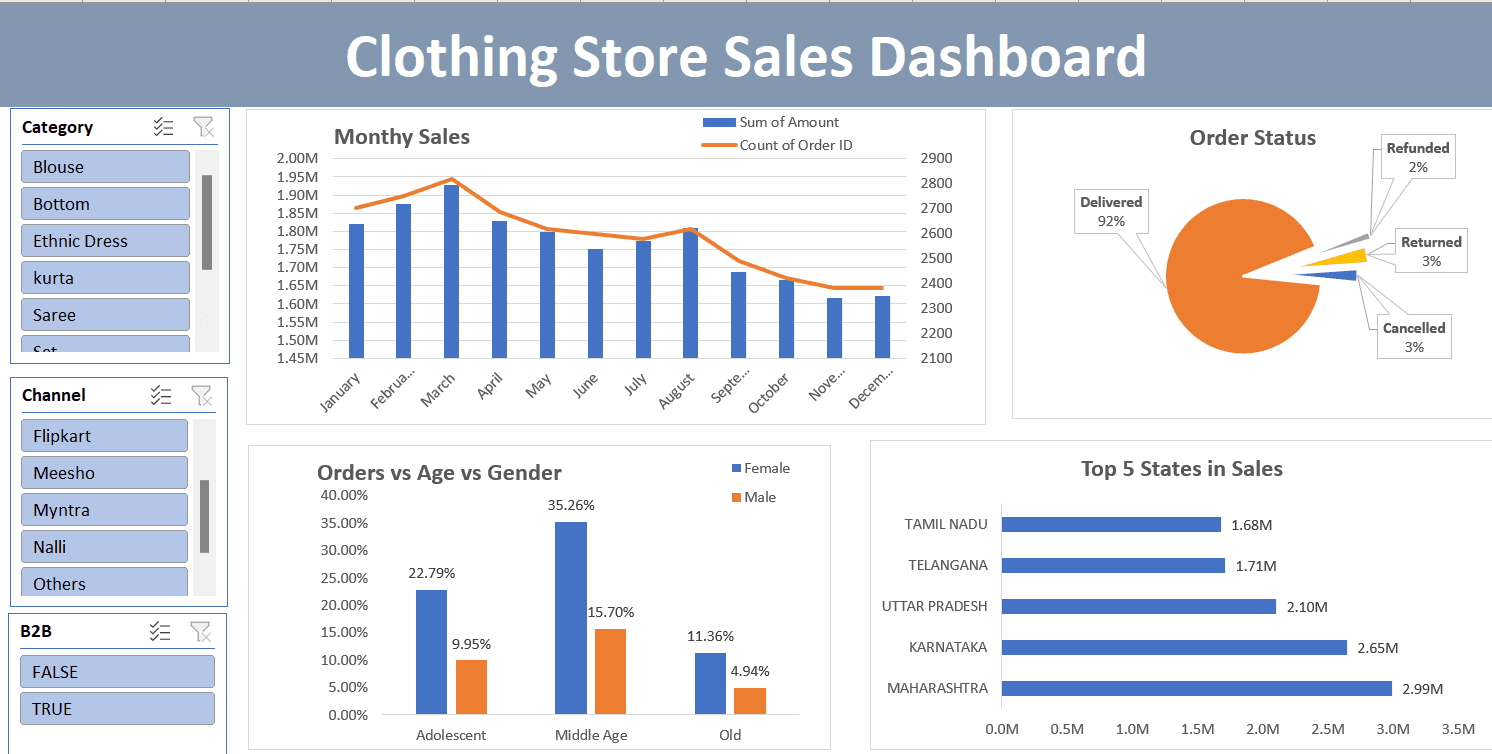
Interactive Dashboard
Bringing Data to Life
Our Excel dashboard provides a dynamic view of the data through:
• Monthly Sales Bar Chart: Visualize sales trends over time.
• Age, Gender, and Orders Chart: Explore the relationship between customer demographics and purchase behavior.
• Top States Sales Chart: Identify geographical hotspots for fashion retail.
• Order Status Distribution: Understand the efficiency of order fulfillment.
Customizable Filters:
• Category: Drill down into specific product types.
• Channel: Compare performance across different sales platforms.
• B2B: Toggle between business and consumer sales data.
Key Findings
Insights that Drive Decision Making
1. Geographic Goldmines: Maharashtra and Karnataka lead in sales, highlighting the impact of urban centers on fashion retail.
2. The Power of Mid-Life Fashion: Middle-aged females emerge as the highest-spending demographic.
3. Satisfied Customers: Extremely low return and cancellation rates indicate high product satisfaction.
4. Festive Fashion Frenzy: Ethnic wear sales peak in October and January, aligning with festival seasons and New Year sales.
5. Channel Challenges: Myntra shows a significant dip in sales during February, March, and April, prompting further investigation.
Implications for the Fashion Industry
Leveraging Data for Fashion Forward Decisions
• Inventory Optimization: Align stock levels with seasonal and demographic demands.
• Targeted Marketing: Craft campaigns that resonate with high-value customer segments.
• Geographical Expansion: Identify potential markets for new store locations or increased marketing efforts.
• Channel Strategy: Optimize sales channels based on performance data and seasonal trends.
Conclusion
In the fast-paced world of fashion retail, data-driven insights are the new black. This project demonstrates the power of Excel analytics in uncovering valuable patterns in consumer behavior, seasonal trends, and geographical preferences. By harnessing these insights, fashion retailers can stay ahead of the curve, offering the right products to the right customers at the right time.
Link to excel workbook - https://docs.google.com/spreadsheets/d/1hDde819vGrPxTf3i_jxuPsILRn6rt8KT/edit?usp=sharing&ouid=109224943858254107621&rtpof=true&sd=true